
Unlocking Your PMO’s Potential: From Underperformer to Champion

 In their massive rock anthem, We Are The Champions, the band Queen boldly declare, “No time for losers, ‘cos we are the champions…”
Perhaps this goes some way to explaining why, in a 2015 ESI International survey, 72% of respondents said their PMO had been challenged by senior management. 1
And today, we’re going to figure out where you sit. Are you a Champion or an Underperformer? Or, most likely, somewhere in between?
Today, we’re going to put numbers on how well your portfolio is performing relative to the best performers... and relative to the worst performers. We’re going to use the PMI’s “Pulse” annual report for 2017 as the benchmark and there’s nowhere to hide.
I don’t do this to be nasty or mean to anyone.
This blog is there to help you get the support you need from your executives to become a real high-performer. Many PMOs are “held back” because the executive team doesn’t really understand the potential business impact of improving project portfolio performance.
I hope this blog will help you articulate the potential up-side of a strong PMO. Use it to win the support of your executive team, to get the mandate to change things around.
Champions and Underperformers
The PMI’s 2017 “Pulse” report compares 2 groups of organisations, the Champions and the Underperformers. 2
Champions: These were 7% of organisations surveyed in the Pulse report. They completed at least 80% of projects on time, within budget and meeting their original goals and business intent, and had high benefits-realisation maturity. These guys are really good!
Underperformers: In contrast, Underperformers completed 60% or fewer projects on time, within budget and meeting their original goals and business intent, and had low benefits-realisation maturity. I suspect many underperformers fall far short of even this benchmark. They represented around 12% of organisations in the survey.
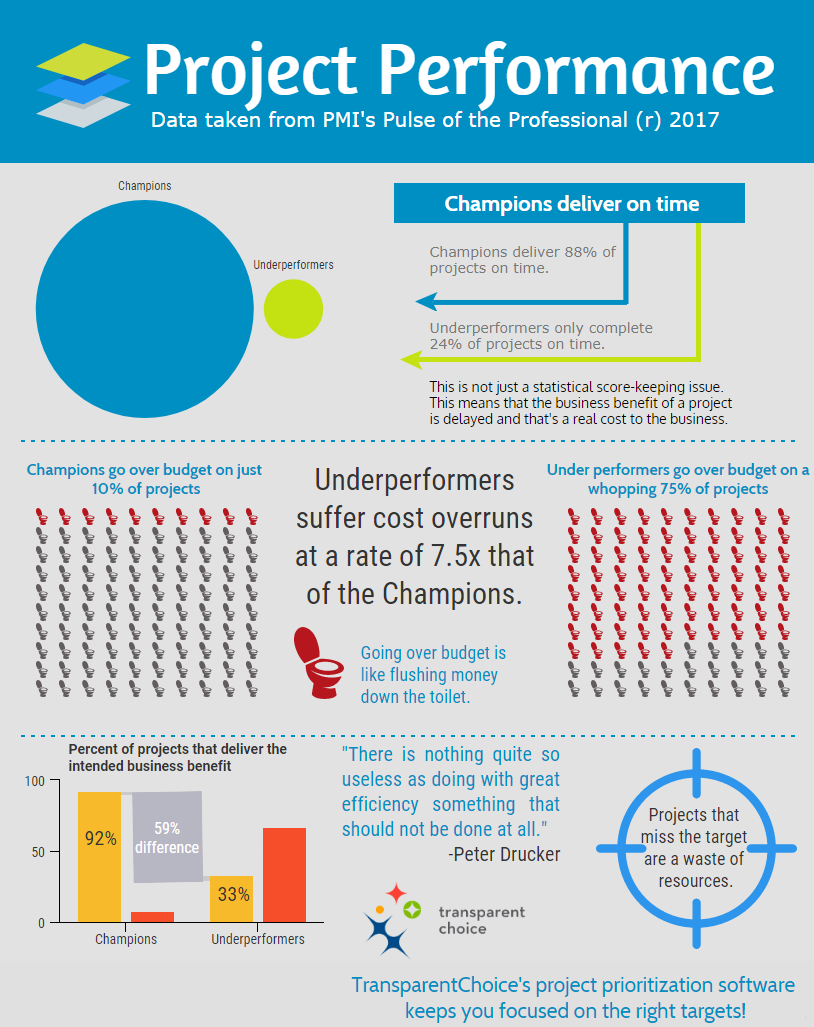
This infographic puts some numbers on the difference between Champions and Underperformers, using the project-performance averages in PMI’s 2017 report. 2 These differences are staggeringly large and have a direct impact on your organization’s overall performance.
It’s in these differences that the business case lies for really investing in a strong PMO.
What makes top-performing PMOs different?
All this data comes from the PMI, which examined several practices that distinguish Champions from Underperformers. One important theme can be summed up in just 3 words:
THEY ACT STRATEGICALLY.
This means they tend to think about portfolio-level activities such as delivering strategic alignment, project prioritization, etc. That doesn't mean they don't look at methodologies and templates, but portfolio-level decisions are an important part of the picture. Let's go on and look at how great the performance difference can be!
Late projects cost real money!
Now, let’s imagine you’re spending $100m per year and that you typically deliver 100 projects with that $100m. An Underperformer is delivering 64 fewer on-time projects than a Champion. You can see it clearly on the infographic, with the big blue circle dwarfing the green one!
That’s 64 projects that are delivered late that would have been on time if you were performing like the best of ‘em.
Let’s say that, on average, those projects are 3 months late and that, on average they cost $1m. Now - here comes the leap - each project exists to deliver business value. Let’s say that value of a typical project is simply that it’s going to save the company its own cost each year (many organizations won’t consider a project unless this is true).
Delaying this project by 3 months means we don’t start saving until 3 months later than we’d planned.
That is a direct cost of $250,000. Yep, delays cost money. It’s not just about making your stats look good; this is real money that’s leaking away when you deliver late.
And you’ve got 64 projects that are delayed. Under these assumptions, that’s $16,000,000 in savings realised later than planned. That is an illustrative portfolio calculation, not a loss measured by PMI.
Don’t blow the budget!
Underperformers suffer 7.5 times as many over-cost projects than Champions.
Seven and a half times. Holy smokes!
Again, let’s assume our $100m / 100 project portfolio. It keeps the maths simple.
Champions will have 10 projects go over budget whereas Underperformers will have 75. That means Underperformers have 65 “extra” projects going over budget.
Let’s assume an “over-budget” project overruns by just 20% (often, projects within 10% of target are deemed “close enough”) and each project has a cost of $1m…
65 projects x 20% overrun x $1,000,000 cost per project = $13,000,000
$13,000,000 in additional overrun costs in this illustrative portfolio!
Are you hitting the target?
The whole point of your project portfolio is to deliver the strategy of your organization (while ensuring compliance, etc.). If you’re not delivering on that strategy, then your portfolio is a waste of money and of people’s lives!
And there’s a massive difference between Champions and Underperformers in this area.
Underperformers only deliver on the business goals of the project 33% of the time. Champions deliver business goals 92% of the time.
Meeting stated goals is an important measure, but it is not the whole picture of project success and contribution to the wider portfolio.
Now, in our familiar 100-project portfolio, the difference between the Champion and Underperformer rates is 59 projects meeting their original goals and business intent. That does not mean 59 projects produced nothing useful. But it gives us a way to think about the value that might be at stake.
Let’s assume those 59 additional projects each had an expected annual benefit of $1m but realised only 30% of that intended value. Does that seem fair? It’ll do for now so we can work on some numbers.
That leaves a 70% shortfall against the expected benefit. Let’s plug in the numbers.
59 projects x 70% unrealised benefit x $1m expected annual benefit per project = $41.3m
$41,300,000 in illustrative annual benefits not realised!
That is not a PMI finding or a calculation of wasted project expenditure. It is an example of the business value that can be at stake when projects miss their intended outcomes.
It also illustrates the opportunity cost of poor project performance. We should not simply add it to the earlier delayed-savings example, because the same benefits could be counted in both.
The important point is to make the business consequences visible, not just the project-performance statistics.
Project prioritization matters
In PMI’s research, 50% more also finished on time and 45% more finished within budget. 3
Project prioritization and selection have a direct impact on project success.
There are many reasons for this, including better executive sponsorship, better alignment between project-and-resource, better scope management, etc.
If you’re looking to improve portfolio performance, this makes project prioritization the quickest of quick-wins. Changing the way projects are implemented takes time. You have to influence and change the way every member of your project delivery organization works and that takes time, money, persistence and (quite often) the patience of a saint!
In contrast, project prioritization can be “sorted” in just a few meetings and affects only a handful of people. We often see benefits within weeks.
But there is a right way to do prioritization. My rule of thumb is that if it “ain’t AHP, it ain’t valid”. This guide tells you more on project prioritization methods - I won’t digress too far here.
Prioritization is a multi-criterion, multi-person decision. AHP provides a structured way to compare priorities and work through differences in judgement.
We think AHP is particularly usable in this setting, and that’s why we built it into our project prioritization software.
So what?
The chances are that you are not a Champion if you’ve read this far.
You’re probably not an Underperformer either. You’re probably somewhere in-between. This means you still have room for improvement.
I talk to many PMO leaders who know what needs to be done to deliver more consistently, but who don’t have support from executives to make the necessary changes. So, step one is to go get that executive mandate and support.
Start by making the problem visible. Measure, as best you can, your own performance and build your own “what poor project delivery is costing” presentation, infographic, or something equally visual and compelling. I used Venngage, for example, to create the PMI Pulse of the Profession(r) infographic on this page.
Be really clear on the following points:
- Here’s where we are (your current performance)
- Here’s where you could be (don’t be over-ambitious and be cautious with timelines)
- Here’s the benefit to the organization. If you talk about fewer “late projects”, turn that into real business benefit something like the way we did in this blog
- Be clear about what the cost is, and how long it’s going to take (longer than you think, so give yourself lots of runway)
- Be clear about what you need to be successful. In particular, talk about technology, people and, most importantly, executive support.
Armed with this little lot, go socialize the discussion with as many influencers and stakeholders as you can before “formally” presenting it. This will ensure you have the best chance of getting the support you need.
The rest is up to you. I’d typically recommend starting with high-impact, low-effort items like “sorting project prioritization” (tho’ I am biased), but some people prefer to start with looking at methodologies, registers and governance.
This podcast is great. In it, Amanda Oakenfull of Deloitte talks about how she turns around projects (and the same approach works at the portfolio level) and she makes it deceptively simple.
In this webinar, Mike Hannan of Fortezza Consulting, talks about how to dramatically increase the “upside” from your portfolio. Again, some good, practical advice.
In fact, we have a whole page with lots of useful (we hope) material for anyone wanting to improve the performance of their portfolio of projects.
Getting to be a Champion can be a long and difficult road, but it’s definitely worth the effort. Heck, even Queen said, “It’s been no bed of roses, no pleasure cruise,” and I suspect most Champion PMO leaders have endless stories to tell about what it took to get there.
So go ahead. Challenge yourself, challenge your executives, challenge your whole team to be Champions!
Good luck!
References
- ESI International, Global State of the PMO 2015 announcement, PMO Challenge findings. ↩
- Project Management Institute (PMI), Pulse of the Profession 2017, champion and underperformer definitions and Figure 2, pp. 5–6. ↩ ↩
- Project Management Institute (PMI), The Strategic Impact of Projects: Identify Benefits to Drive Business Results, 2016, Figure 5, p. 15. ↩